
With PHP & MySQL it's pretty simple: use individual SQL queries to get the count of yesterday, yesterweek, yestermonth, yesteryear and do the layout in PHP.
Now let's say I have one RDL or SSRS Solution. I could do a dataset per SQL query but it doesn't seem that ideal.
In Theory:
SELECT
     ItemName,
     DATEPART(dayofyear, ItemDate) as DayOfYear,
     DATEPART(year, ItemYear) AS YearRun,
     COUNT(ItemName) AS Counter
FROM
     TableName
WHERE
     ItemDate BETWEEN '01/01/2010' AND '08/01/2011'
GROUP BY
     DATEPART(dayofyear, ItemDate),
     DATEPART(year, ItemYear),
     ItemName


// yields something like

ItemName              DayOfYear      YearRun Counter
--------------------- -------------- ------- -------
Report 001            181            2010    134
Report 002            192            2010    12
Report 003            305            2010    479
Report 001            202            2011    84
Report 002            202            2011    45
Report 003            287            2011    94
A working example using the ReportServer database in SSRS 2008 R2:
SELECT
	Catalog.Name AS ReportName,
	DATEPART(dayofyear, ExecutionLogStorage.TimeStart) AS DayOfYearRun,
	DATEPART(week, ExecutionLogStorage.TimeStart) AS WeekRun,
	DATEPART(year, ExecutionLogStorage.TimeStart) AS YearRun,
	COUNT(Catalog.Name) AS Counter
FROM
	ExecutionLogStorage
	INNER JOIN
	Catalog ON ExecutionLogStorage.ReportID = Catalog.ItemID
WHERE
	(Catalog.Type = 2)
        AND (ExecutionLogStorage.TimeStart BETWEEN '01/01/2010' AND '08/01/2011')
GROUP BY
        DATEPART(dayofyear, ExecutionLogStorage.TimeStart),
        DATEPART(week, ExecutionLogStorage.TimeStart),
        DATEPART(year, ExecutionLogStorage.TimeStart),
        Catalog.Name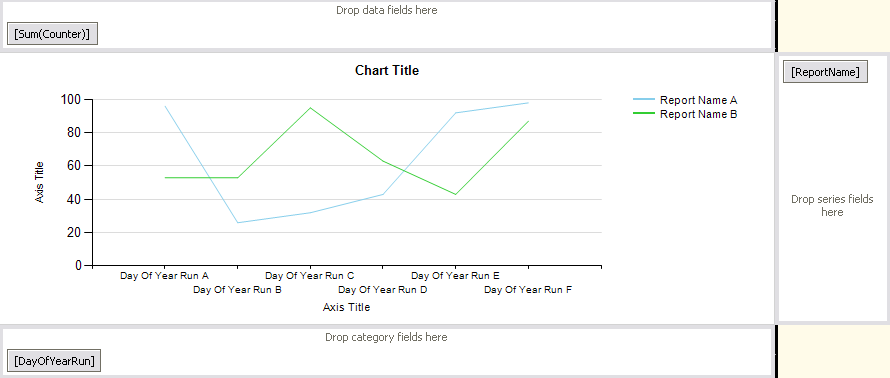
So is this doing what I wanted?
Well NO. I have a table with the same report mentioned several times but just in a different week. I want a returned table structured as follows:
Report Name        Run Last Week     Run This Week
------------------ ----------------- -------------------
Report 001         5                 2
Report 002         11                47
Report 003         7                 61
Multiple Datasets?
Again NO that's what I have at the moment. There must be a way. Or is time always on that dimension? HAVING is pointless, WITH ROLLUP is interesting, think I'm looking in the wrong place.
Using Aggregate Functions?
What follows is the T-SQL Query I finally went with. Lots of numbers but I think this pretty much answered my question:
SELECT
	Catalog.Name AS ReportName
	, MIN(ExecutionLogStorage.TimeStart) AS [First]
	, MAX(ExecutionLogStorage.TimeStart) AS [Last]
	, CAST(CONVERT(CHAR, DATEADD(millisecond, MAX(DATEDIFF(MILLISECOND, ExecutionLogStorage.TimeStart, ExecutionLogStorage.TimeEnd)), '00:00:00'), 121) AS TIME) [High]
	, CAST(CONVERT(CHAR, DATEADD(millisecond, MIN(DATEDIFF(MILLISECOND, ExecutionLogStorage.TimeStart, ExecutionLogStorage.TimeEnd)), '00:00:00'), 121) AS TIME) [Low]
	, CAST(CONVERT(CHAR, DATEADD(millisecond, AVG(DATEDIFF(MILLISECOND, ExecutionLogStorage.TimeStart, ExecutionLogStorage.TimeEnd)), '00:00:00'), 121) AS TIME) [Average]
	, CAST(CONVERT(CHAR, DATEADD(millisecond, SUM(DATEDIFF(MILLISECOND, ExecutionLogStorage.TimeStart, ExecutionLogStorage.TimeEnd)), '00:00:00'), 121) AS TIME) [Total]
	, COUNT(Catalog.Name) AS Counter
FROM
	ExecutionLogStorage
	INNER JOIN
	Catalog ON ExecutionLogStorage.ReportID = Catalog.ItemID
WHERE
	(Catalog.Type = 2)
        AND (ExecutionLogStorage.TimeStart BETWEEN '01/01/2010' AND '08/01/2011')
GROUP BY
        Catalog.Name


// yielded
ReportName            First                   Last                    High                                         Low    Average   Total    Counter
--------------------- ----------------------- ----------------------- ---------------- ---------------- ---------------- ---------------- ----------------
Report 001            2011-07-11 15:46:25.637 2011-07-12 12:14:21.600 00:00:02.2130000 00:00:00.0470000 00:00:00.2600000 00:00:03.3770000 13
Discussion
Comments
Questions, corrections and useful additions are reviewed before appearing here.
Discussion Newest first
No comments yet. Start the discussion.