This is just a note for me as it took a while to find on the net and even then it was confusing as to why it works but it does. Not sure whether you call this an MDX Query or part of a Transact-SQL mashup. You need to go to "Fill" (of each text box in the row - unless there's a faster way) and instead of color, click on the expression button (fx) and use the following:
=IIF(RowNumber(Nothing) Mod 2, "#ffffff", "#eeeeee")

or

=IIF(RowNumber(Nothing) Mod 2, "WhiteSmoke", "Garamond")
- =IIF(RowNumber(Nothing) Mod 2, "#ffffff", "#eeeeee")
- or
- =IIF(RowNumber(Nothing) Mod 2, "WhiteSmoke", "Garamond")
This is telling the report to be white (=#ffffff) in row 1 (odd row numbers) and a very light grey (=#eeeeee) in row 2 (even row numbers). The first row being of all rows in the dataset and not for a particular drill-down item. It will alternate between the two for the rest of the report. [The second example is what I use most frequently].
Additional:
Suppose you have lots of columns, you don't want to have to click on each cell to specify this so just do it to the first column then bring up the properties pane and scroll down to the "Fill > BackgroundColor" row and copy the value to your clipboard or notepad, etc. Then select all the remaining cells in the row and paste your expression in the "Fill > BackgroundColor" properties row... Done!
Borders:
I'm putting this here because often enough, if I'm going to make the report pretty with alternating rows, I'm probably going to look at the cell borders as well. I want a bigger border at the bottom of the overall report and a light one to divide each record. Staying within the properties pane, you can do the following:
BorderColor:
#efefef, , , White, =IIF(RowNumber(Nothing)=Count(Fields!Field1.Value, "DataSet1"), "Black", "LightGray")

BorderStyle:
None, , , Solid, =IIF(RowNumber(Nothing)=Count(Fields!Field1.Value, "DataSet1"), "Double", "Solid")

BorderWidth:
1pt, , , , =IIF(RowNumber(Nothing)=Count(Fields!Field1.Value, "DataSet1"), "3pt", "1pt")

-- where "Field1" is a column in my dataset and "DataSet1" is my dataset
-- and Count(Fields!Field1.Value, "DataSet1") returns the maximum number of rows retrieved
- BorderColor:
- #efefef, , , White, =IIF(RowNumber(Nothing)=Count(Fields!Field1.Value, "DataSet1"), "Black", "LightGray")
- BorderStyle:
- None, , , Solid, =IIF(RowNumber(Nothing)=Count(Fields!Field1.Value, "DataSet1"), "Double", "Solid")
- BorderWidth:
- 1pt, , , , =IIF(RowNumber(Nothing)=Count(Fields!Field1.Value, "DataSet1"), "3pt", "1pt")
- -- where "Field1" is a column in my dataset and "DataSet1" is my dataset
- -- and Count(Fields!Field1.Value, "DataSet1") returns the maximum number of rows retrieved
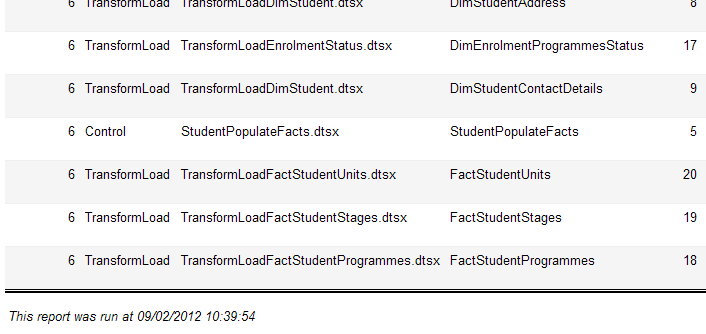
Yields something like:
This is the bottom left of a report where both the above examples (fill and borders) have been applied:


Add comment